AWS CloudWatch
AWS CloudWatch is a service that monitors cloud activities, acting as a gatekeeper for AWS. It provides monitoring, alerting, reporting, and logging of activities in an AWS account.
Key features of CloudWatch are :
Resource Monitoring: CloudWatch collects details when resources like EC2 and S3 are created.
Real time metrics include the number of requests received by an application on an EC2 instance, CPU utilization, and memory consumption over time.
Alarms: Alarms can be set up to notify when a metric crosses a certain threshold, such as an EC2 instance reaching 80% CPU utilization.
Logging: Logs can be used to track the access of services to resources, like when a service accesses S3.
Custom Metrics: Custom metrics can be sent to CloudWatch for parameters that are not covered by default.
Dashboard :
AWS cloudwatch allows to create custom dashboard to visualize and monitor AWS resources and applications.
Dashboard
1.1 Go to AWS console -> Search CloudWatch -> select Dashboard

1.2 Select create dashboard and give dashboard name

1.3 Select the widget and select next
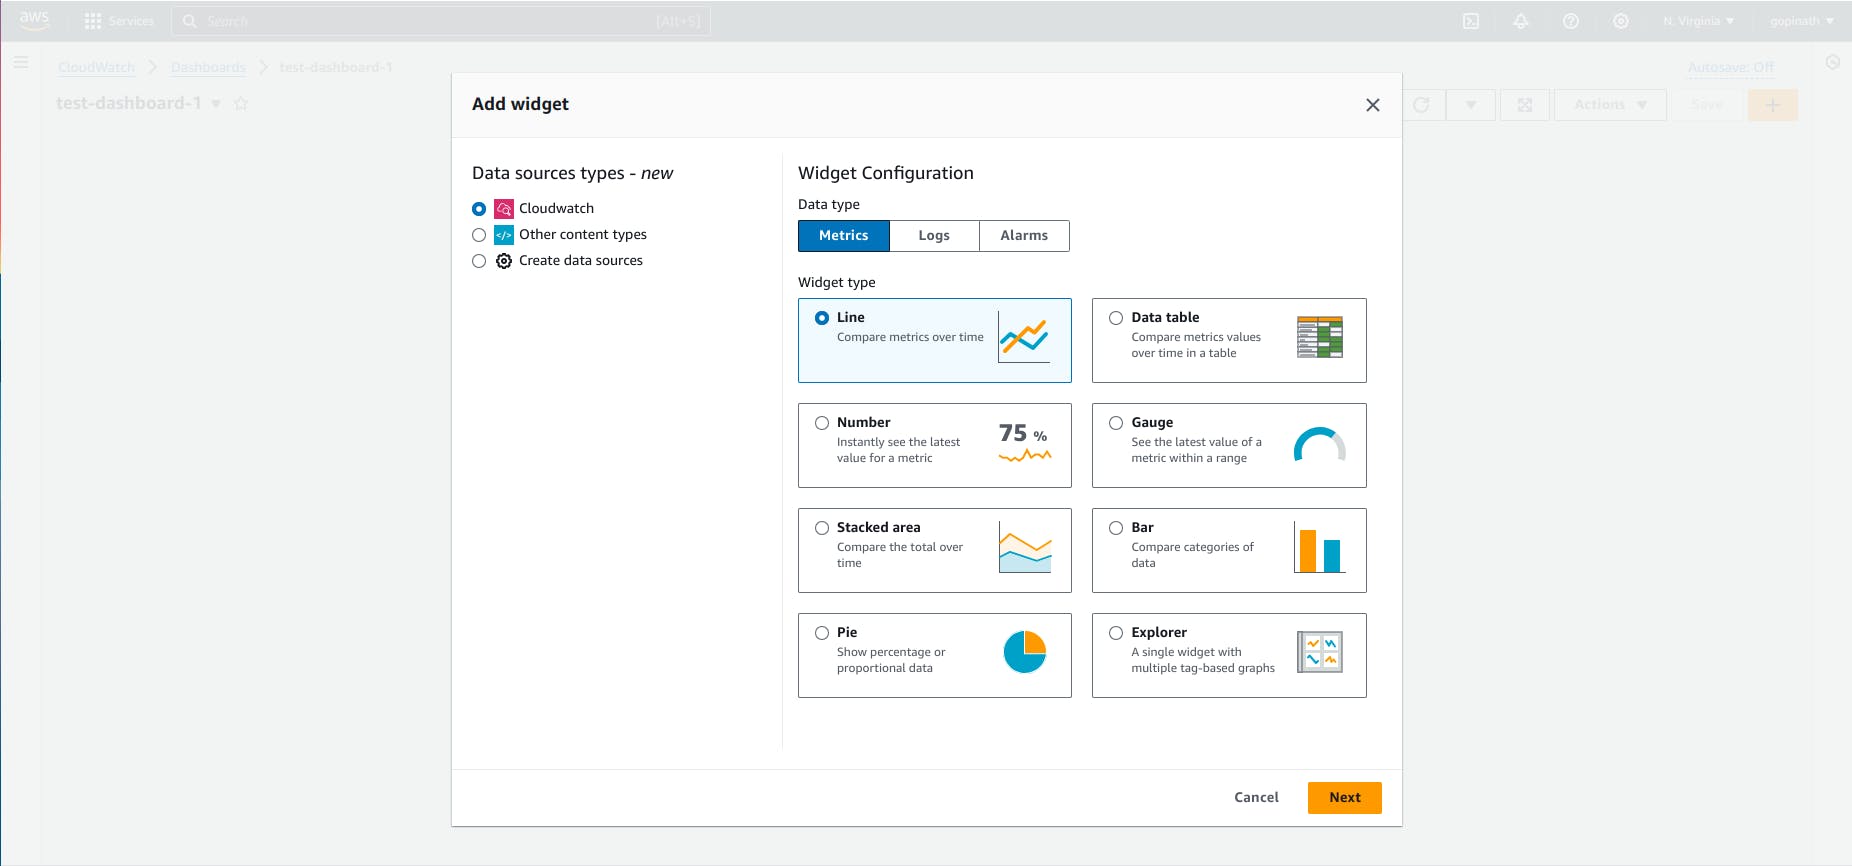
1.4 Select the resource to see the metrics

1.5 Select Per-insatance metrics

1.6 Select the metric name and instance to visualize them.
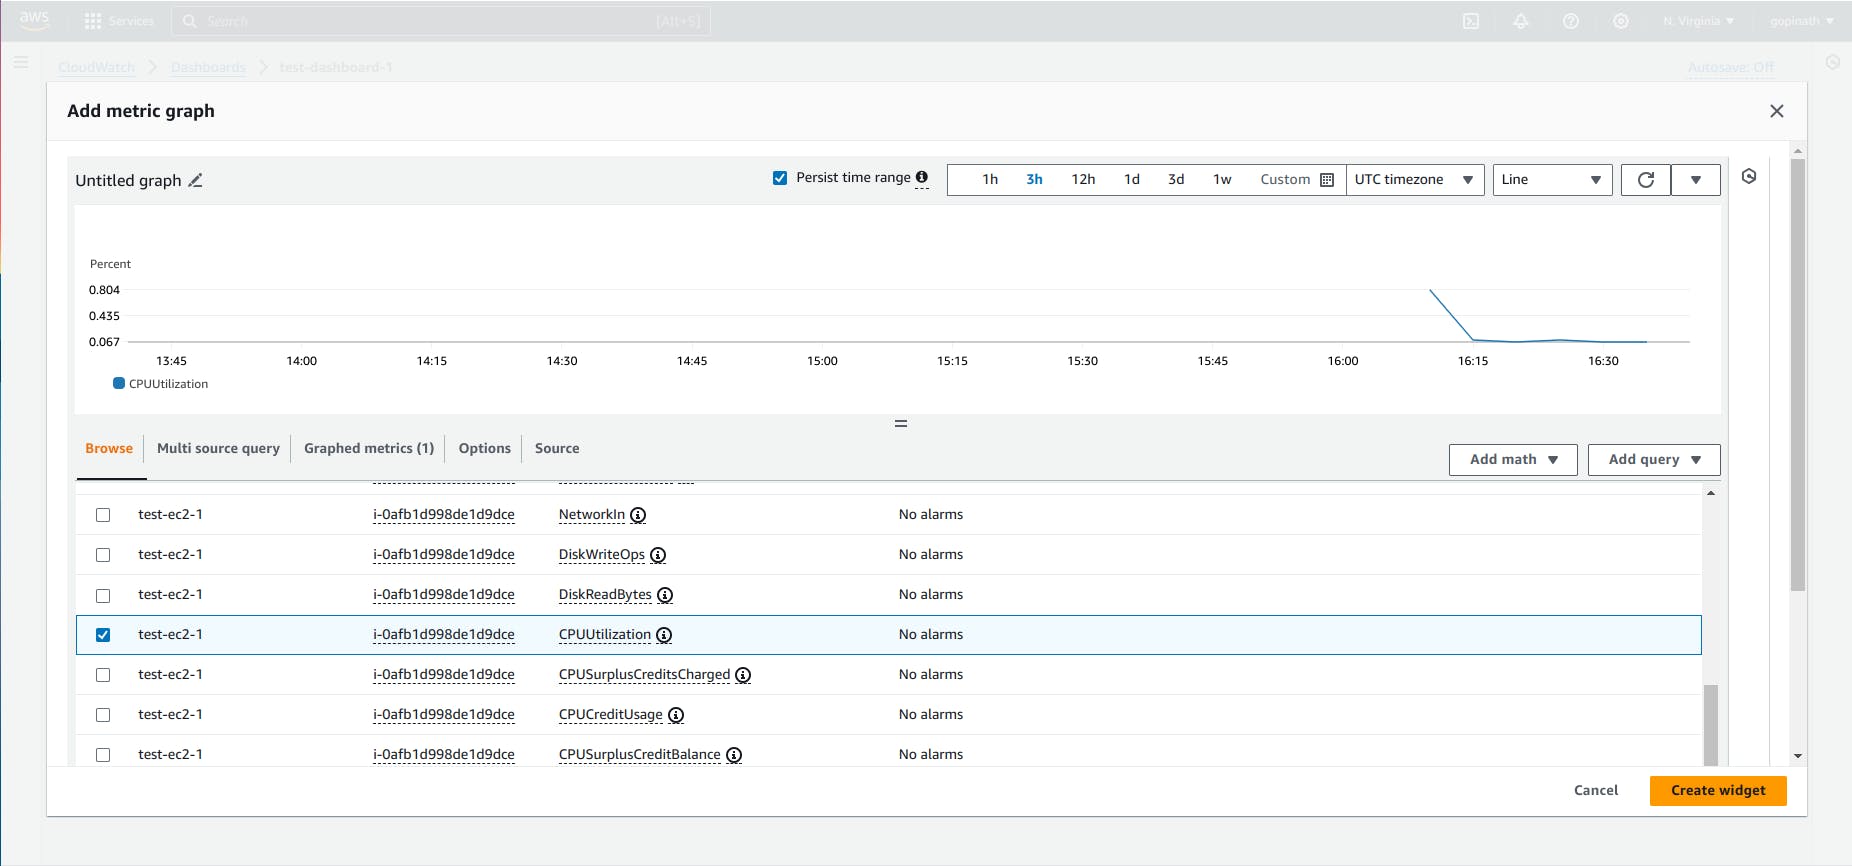
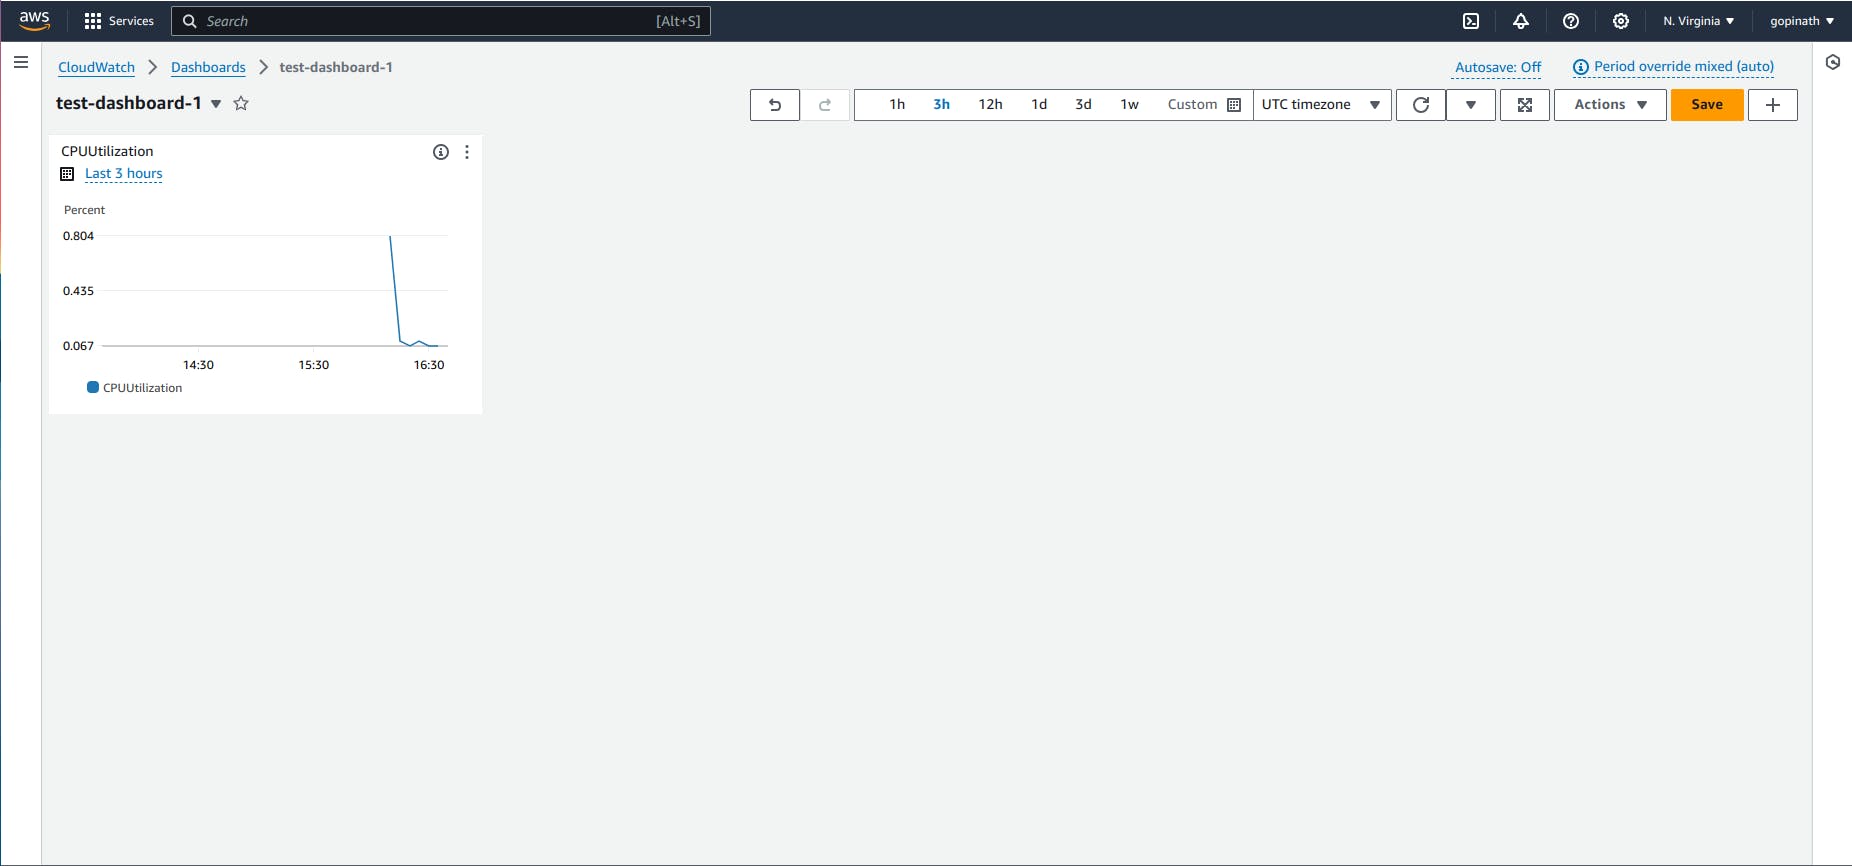
1.7 Selected metric and instance will be visible in the dashboard.
Alarm
2.1 Go to alarm section -> select create alarm
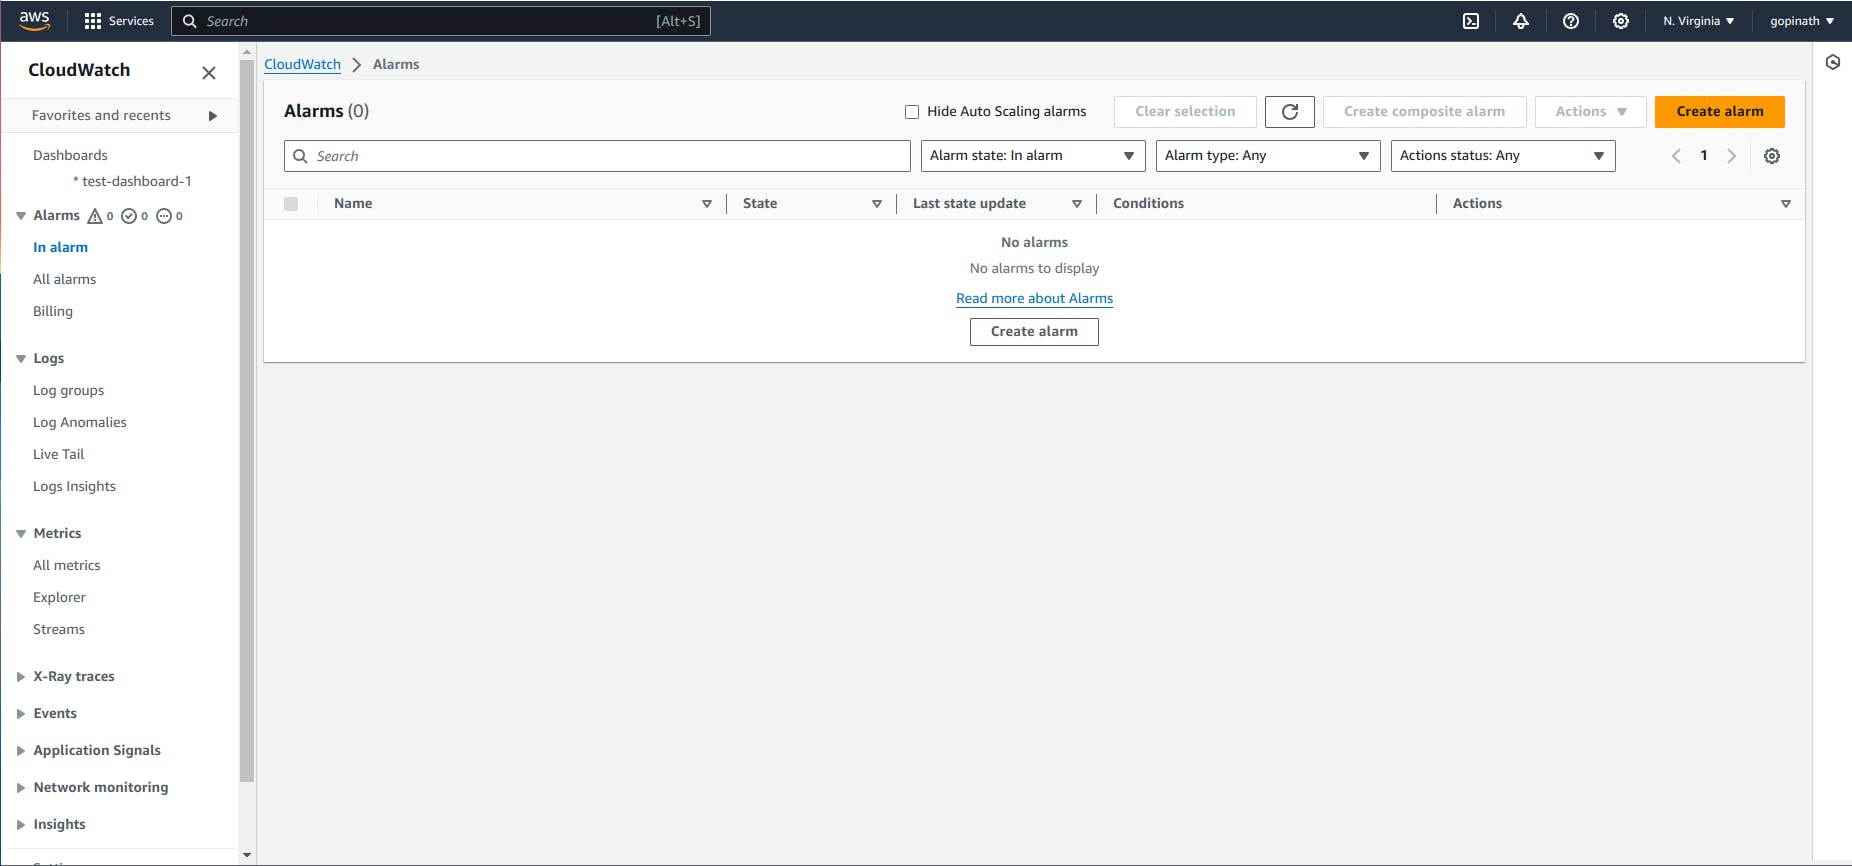
2.2 Select the metric.
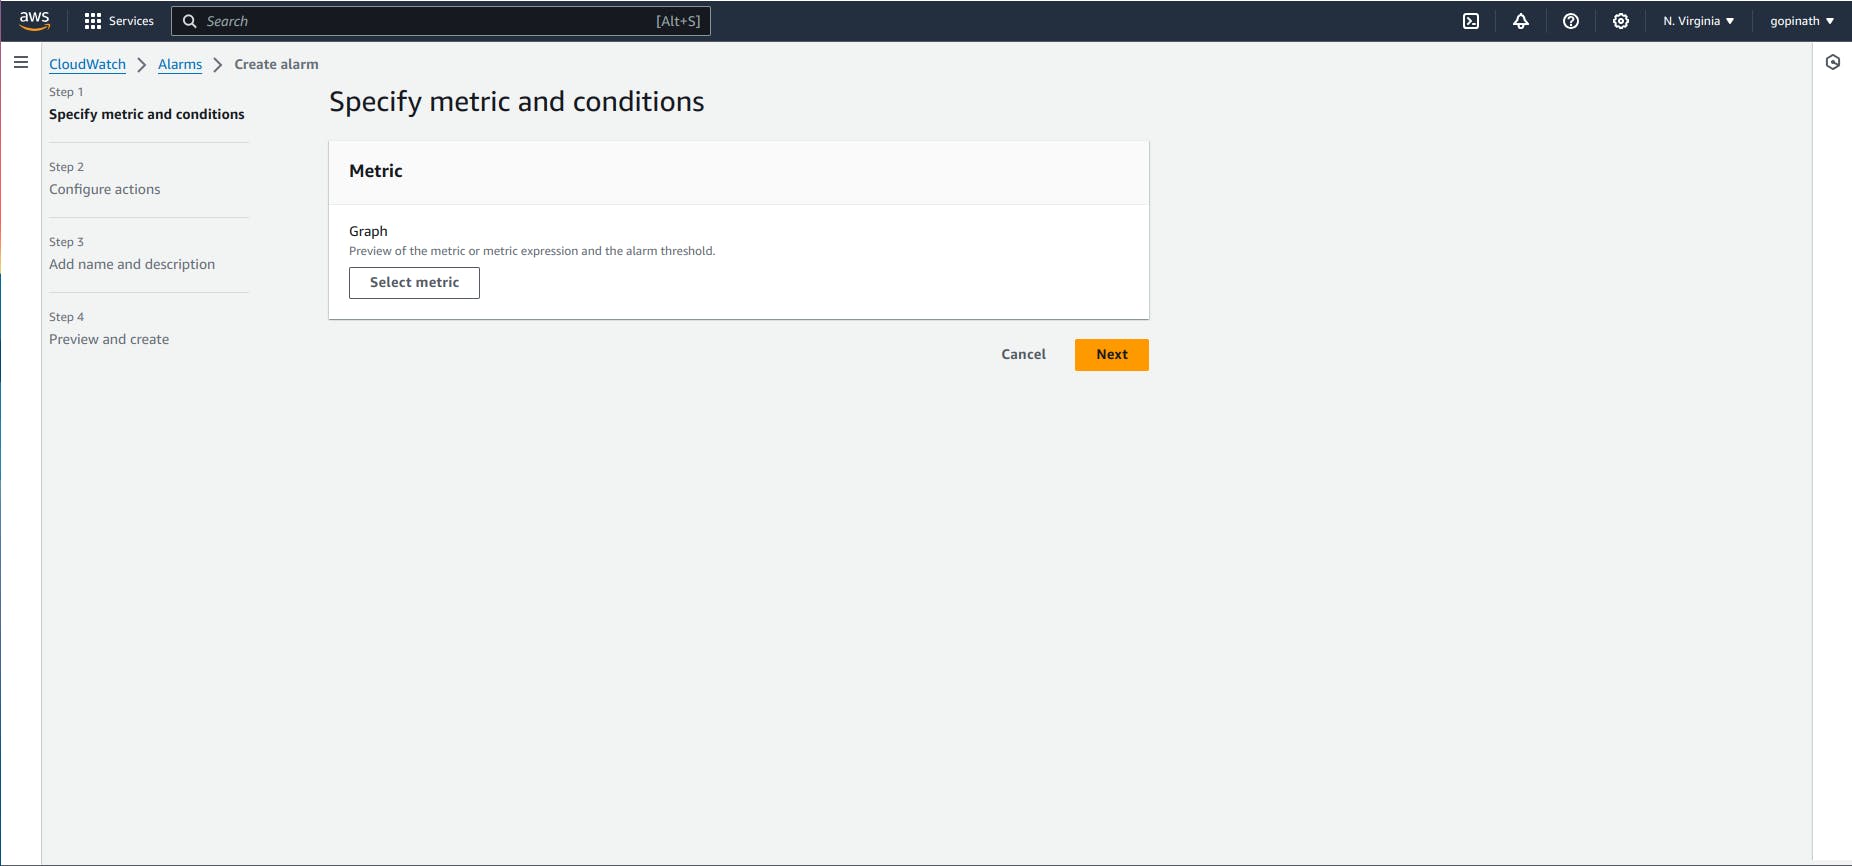
2.3 Select the service to set alarm
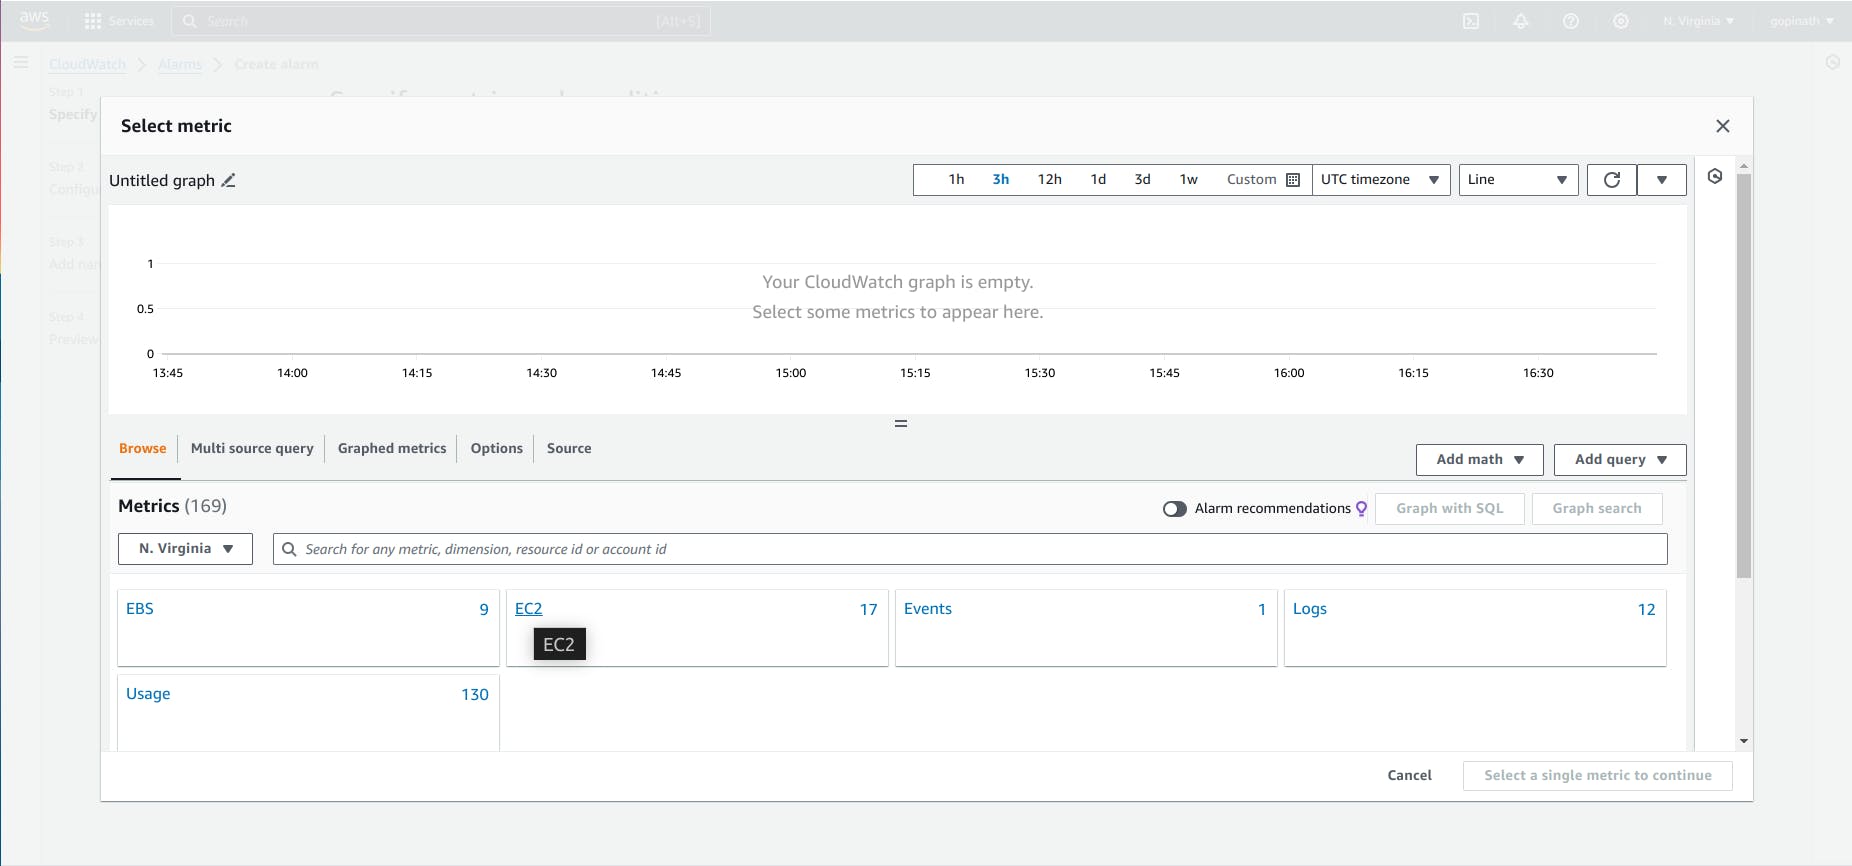
2.4 Select the metric name and instance to visualize them.

2.5 Select the statistic and period

Statistic - It is a aggregation function used to evaluate the metric over the specific period.
Period - It is the length of time in seconds that CloudWatch uses to evaluate the metric specified in the alarm.
2.6 Specify conditions and click next.
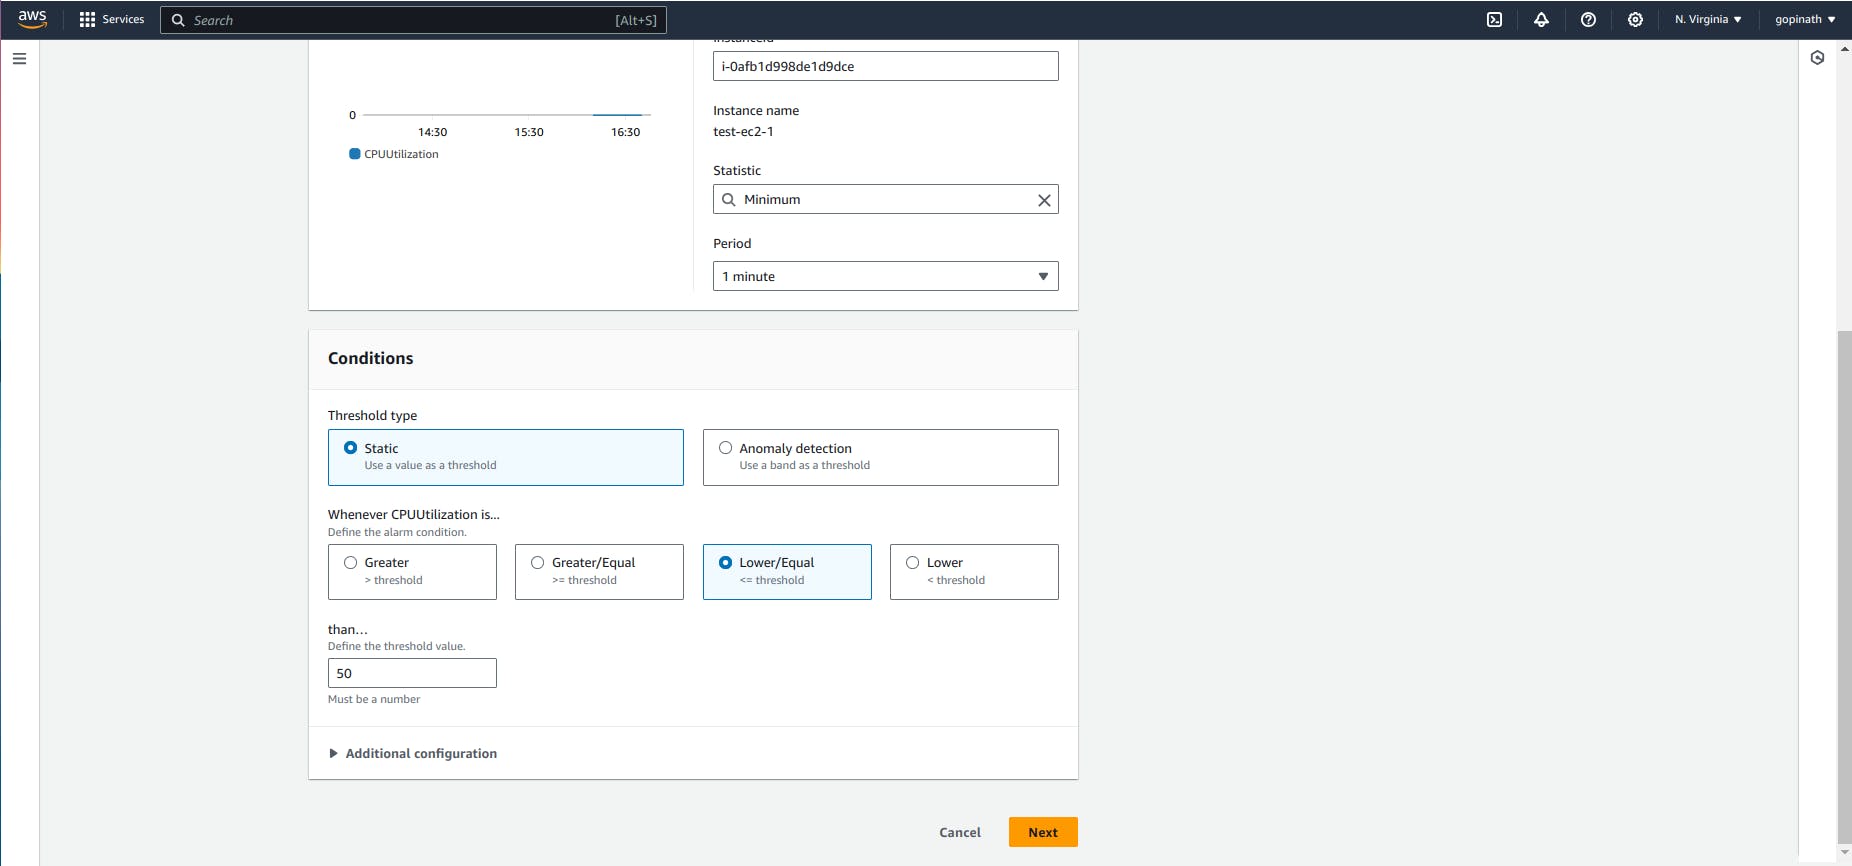
Threshold Type :
i) Static : In static, we can specify the threshold value.
ii) Anomaly detection : In this, AWS uses machine learning algorithms to analyse the historical values of metrics and automatically determine the abnormal behaviours.
Threshold value : specify the threshold value here. When metrics reaches or exceeds alarm will be triggered.
2.7 Select the SNS(Simple Notification Service) or create new SNS to send the email.
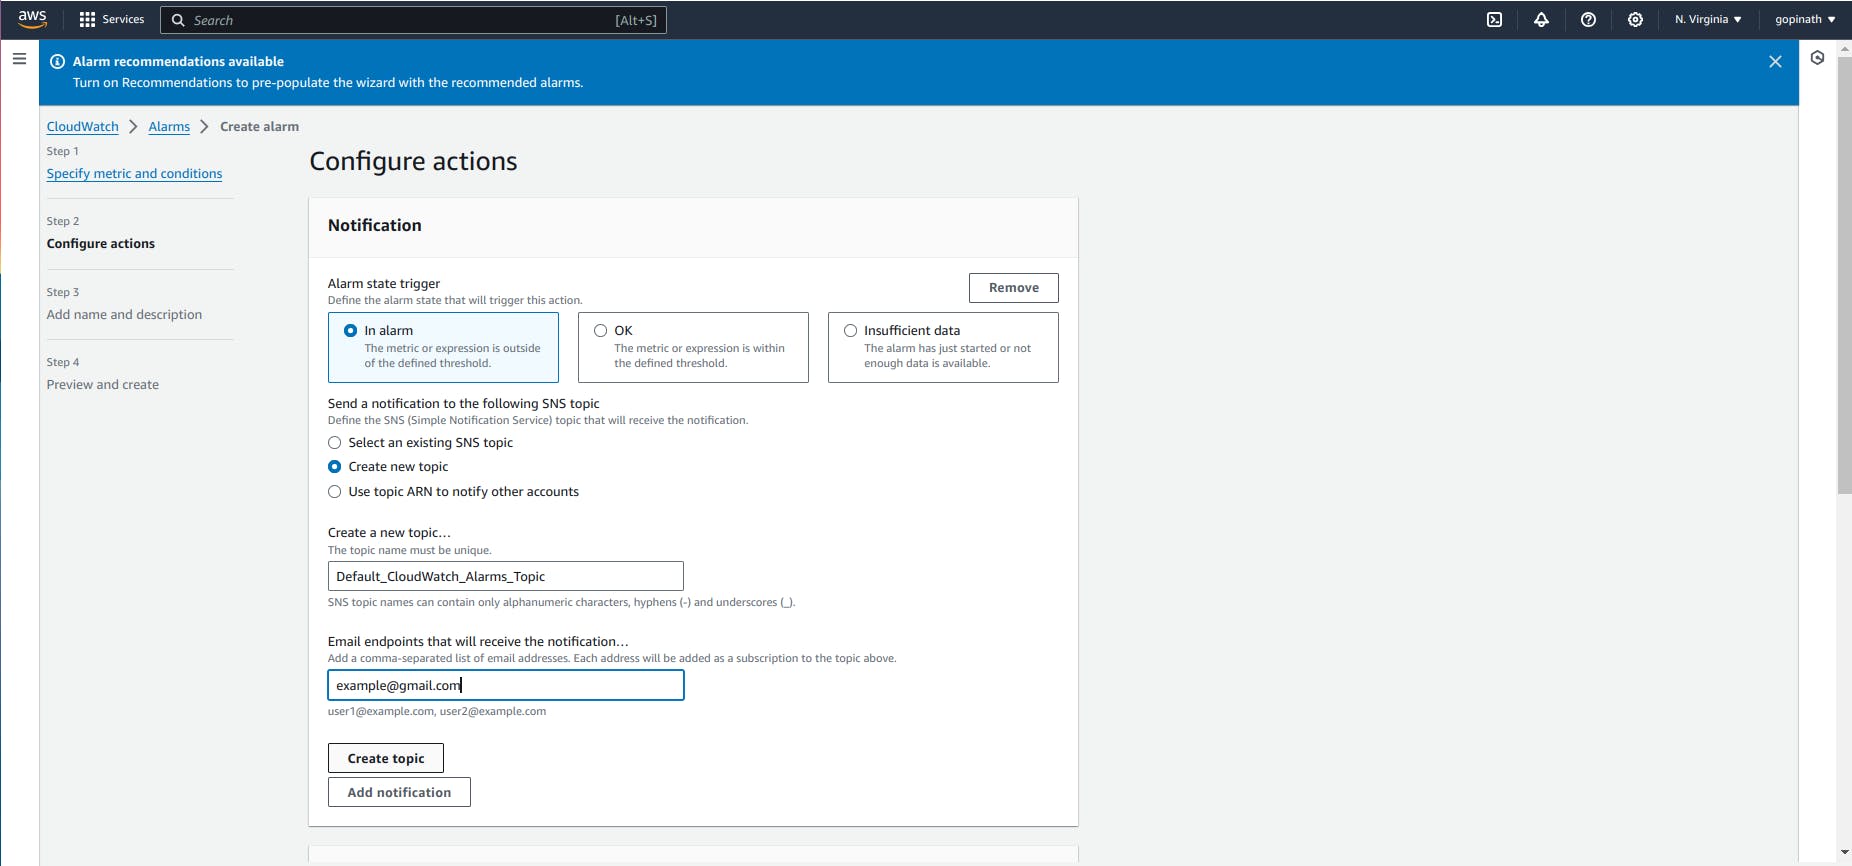
In my case, I have selected Create new pair and added email and selected create topic.
2.8 Select the Create topic to create the SNS topic.
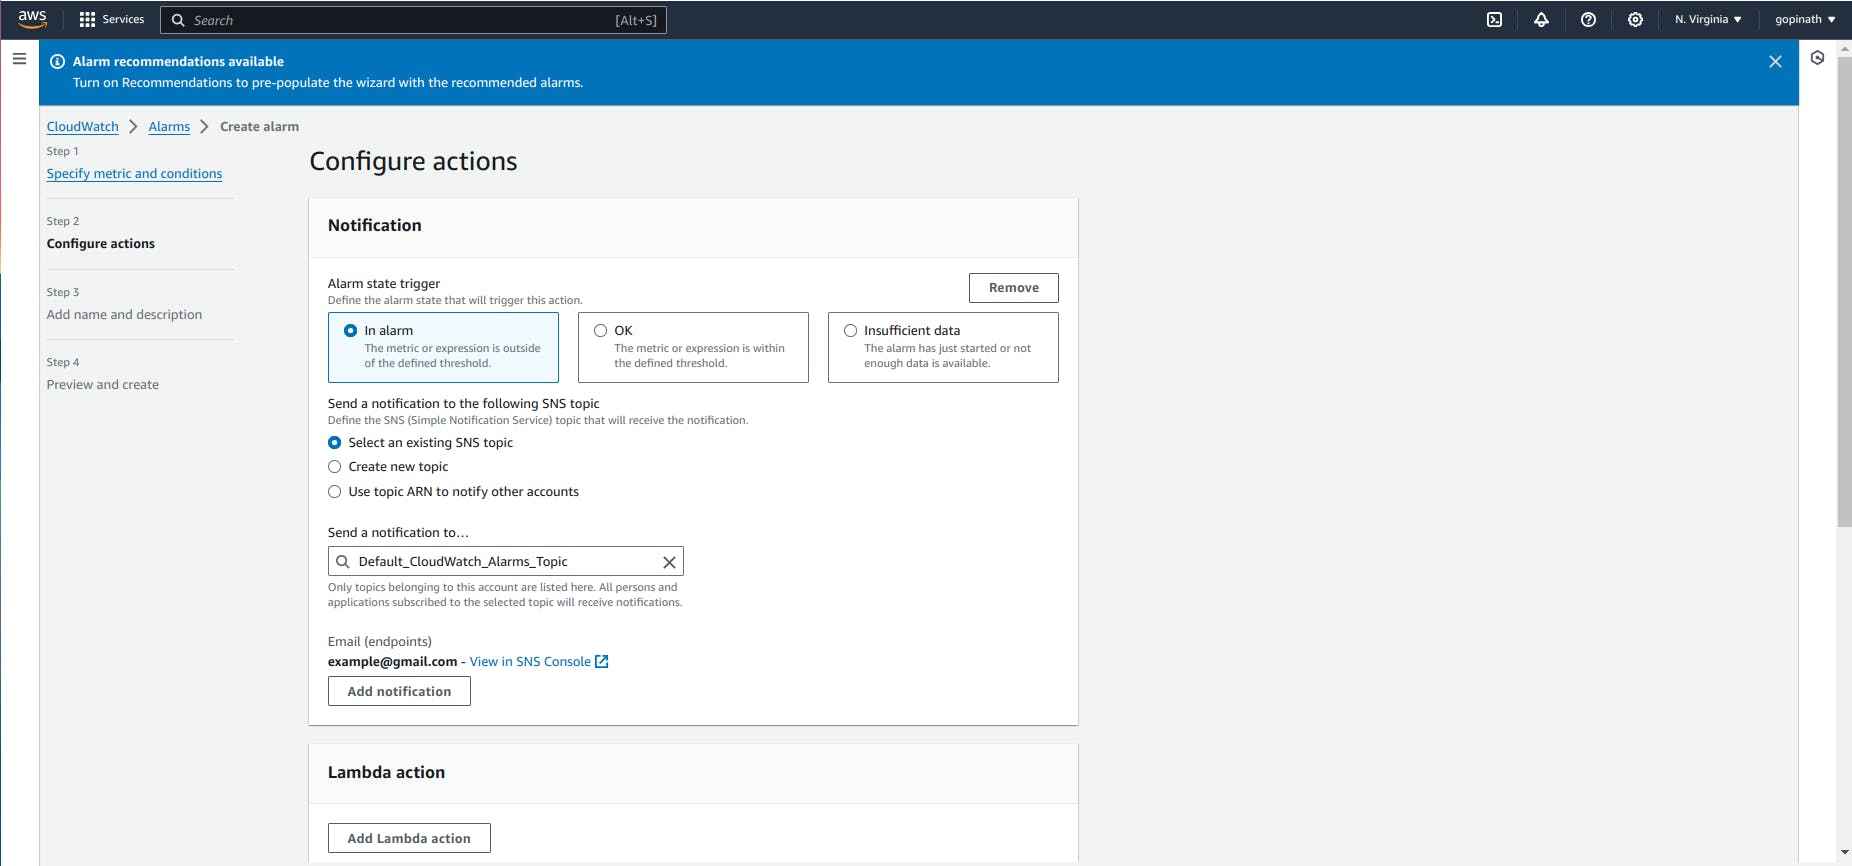
Note : You need to verify the email in the SNS section to receive alarm emails.
2.9 Select the Actions if required.
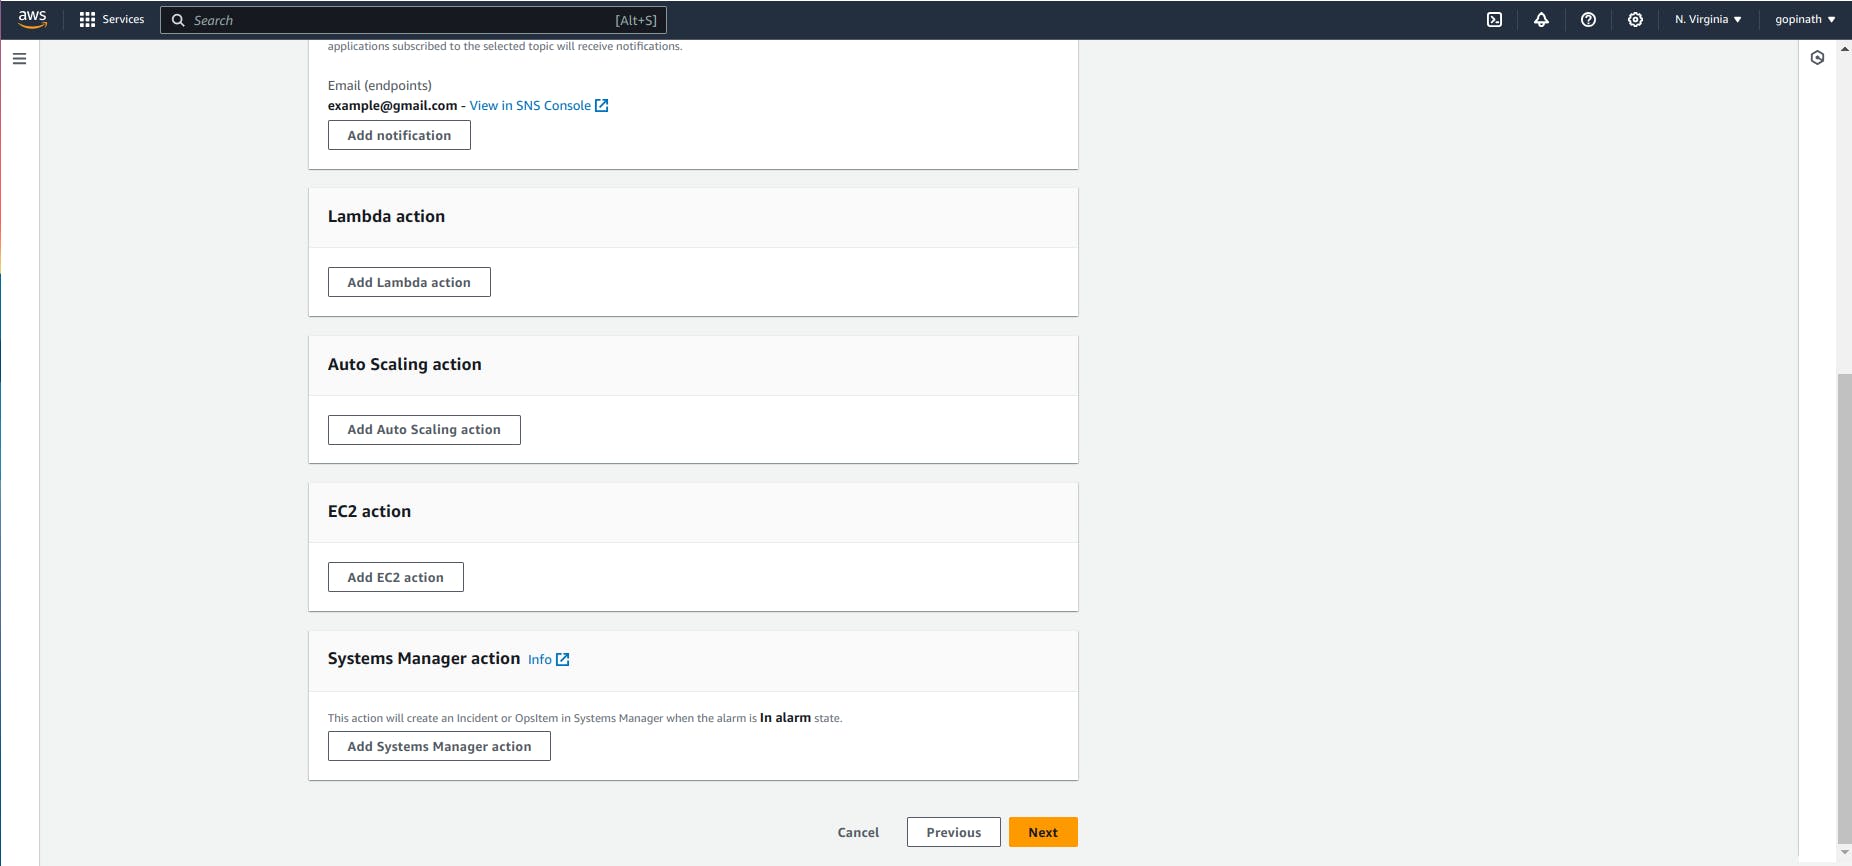
These actions are used to automate something, like when EC2 reaches 80% of its capacity - trigger a Lamda function.
2.10 Specify the alarm name and alarm description

Alaram Name - Used to uniquely identify the alarm.
2.11 Preview the datas.

2.12 After verify the details , Select create alarm.

Monitor Resource in EC2
We can monitor the resource usage of instance in monitor section of EC2.

Conclusion:
In conclusion, AWS CloudWatch is a powerful tool for monitoring and managing your AWS resources, providing valuable insights into the performance and health of your applications.